


Inflation Spotting: Breaking Down the CPI’s 5.4% Increase
While it is not wrong to say that “inflation is the highest it’s been in nearly 13 years” if prices in the CPI are rising, it is slightly misleading.

What is inflation? And what does it mean that the “CPI” has risen 5.4% in the last 12 months?
Inflation Here and Inflation There
The definition of inflation is easier said than seen. In short, inflation is a rise in the general level of prices. And “general level” is important to note: Cars or computer chips may become more expensive, but a lone price increase is not necessarily a sign of inflation. Rather, a lone price increase is instead what is referred to as a change in relative prices.
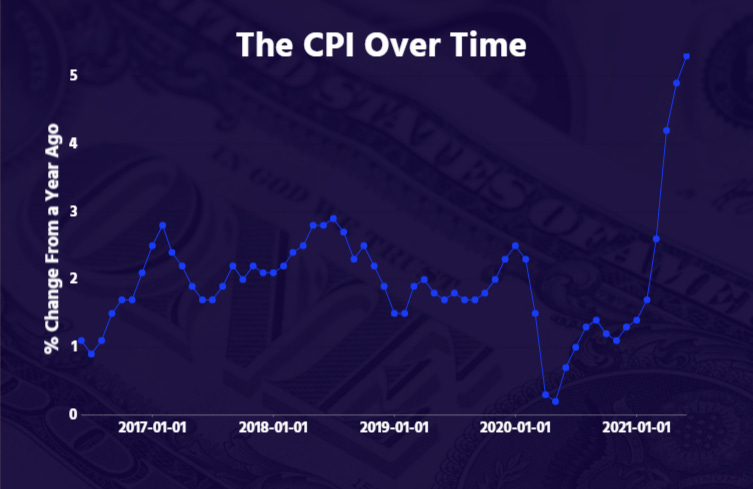
A good example of a change in relative prices occurred at the beginning of the COVID-19 pandemic. Many people worried that inflation was taking hold because the price of groceries had increased by nearly 3% in April 2020. However, groceries are just one good in the vast array of offerings in the economy. When we consider the economy as a whole, the monthly inflation rate had actually fallen to -0.8% in that same month.1
So where do these numbers come from? Let’s take a moment to break down what’s called the “CPI.”
The CPI Increased by 5.4%. So?
The Consumer Price Index, or CPI, is the go-to resource for measuring inflation.2 To measure inflation, prices of goods and services are regularly recorded and then compared to former levels.3 If you scan through the second table in the latest CPI report, you’ll see it includes price changes for everything from bread to funerals. But not all goods are created equal: far more people purchase gasoline than indoor plants. Therefore, after the prices are recorded, they are then weighted per their relative importance.4
So while it is not wrong to say that “inflation is the highest it’s been in nearly 13 years” if prices in the CPI are rising, it is slightly misleading. The problem becomes clear if we look beneath the surface and check the individual changes in the CPI. For example, only a handful of prices rose more than 20% in the last 12 months (see table 1).
Table 1. Big Changes in the CPI

While these changes are eye-catching to say the least, these front-runners are not representative of the general economy. In fact, the vast majority of the changes are well below 20%. I’ve listed a few examples below in table 2.
Table 2. Small Changes in the CPI

And there is still more to the story than what is seen at first glance. The changes here are relative to prices 12 months ago (i.e., the beginning of the economic lockdown). If we look at the 12-month change for the goods listed in table 1 and compare them to last year’s numbers, it becomes clear that part of the increase is due to the recovery (see table 3). Rather than solely shooting for the moon, prices are returning to their pre-pandemic norm.
Table 3. A Look at the 2020 and 2021 CPI Data

Now, “returning to normal” does not explain the full story. But it does take a bit of the sting out of the current headlines.
Giant Bags of Money
So, is it time to take wheelbarrows and giant bags of money with you on trips to the grocery store? No. Prices are rising faster than most people expected, but the United States is nowhere near a hyperinflationary episode. Long-term investors will need to keep an eye on the numbers as the CPI is updated over the next few months, but it is far from time to panic.
Some economists, like Alberto Cavallo, argued that the changes in consumer spending (i.e., due to the lockdown) were reason enough to create a new measure of inflation––one that was more representative of “COVID-spending.”
Other popular metrics include the Personal Consumption Expenditures Price Index (PCE) and Producer Price Index (PPI).
At its simplest, price changes are recorded as (Current Price-Former Price)/Former Price.
In order of importance, here are just a few items from the list: Rent>Gasoline>Electricity>Cable and Satellite TV>Lettuce>Sewing Machines.